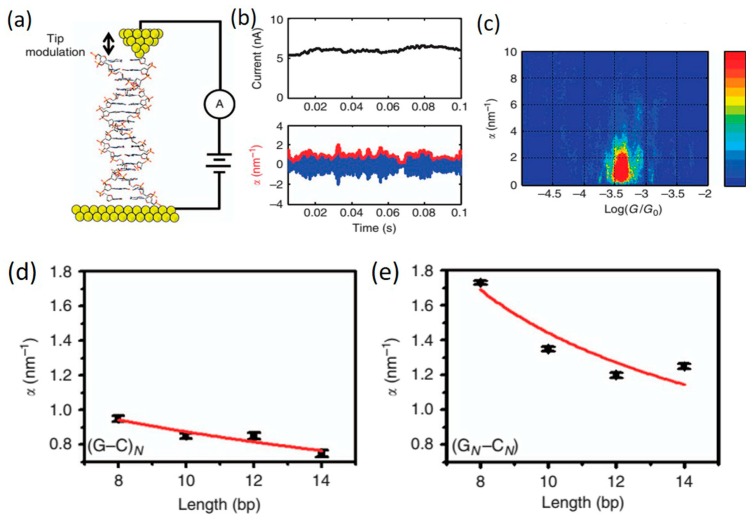
Figure 20.
(a) Schematic diagram of STM-BJ with a modulating tip; (b) Upper: low-frequency component of the current collected from the single DNA junction; lower: the piezoresistance (α) in DNA (red curve) and conductance modulation due to tip modulation (blue curve); (c) α vs. conductance histogram for G-C sequence; α vs. molecular length for (d) (G–C)N and (e) (GN–CN) sequences, respectively. Reprinted with permission from ref. [138]. Copyright (2015) Nature Publishing Group.

