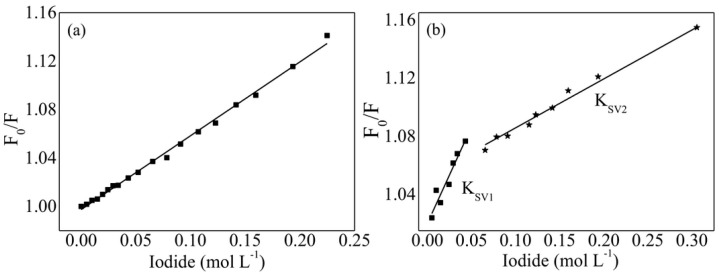
Figure 7.
Stern–Volmer plots for (a) ERY-F127, where ERY is erythrosine, and (b) ERYBUT-F127, where ERYBUT is a butylated erythrosine ester derivative. Fo and F represent the fluorescence intensity of the photosensitizer in the absence and presence, respectively, of iodide, a water-soluble quencher. The samples were prepared by the ethanol thin film hydration method; micelles were re-dispersed by stirring with water at 60 °C for 8 h. In (b), two populations are observed. “ΚSV1” and “ΚSV2” correspond to ERYBUT located near the PEO (corona) and PPO (core) regions, respectively. Reprinted from [112]. Copyright 2016 Wiley.

