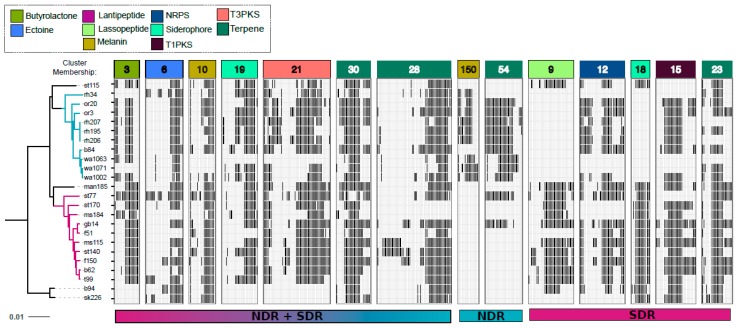
Figure 7.
Gene content of core SMGCs vary within and between clades as a result of gene acquisition and deletion events. Panels depict the gene content (i.e., genetic architecture) of core SMGCs (i.e., conserved in ≥80% of genomes), the NDR-specific SMGC core, and the SDR-specific SMGC core. Black bars within the panels represent orthologous genes. The tree reflects phylogenetic relationships between Streptomyces sister-taxa genomes and was constructed from multiple whole genome alignments (see Figure 1). Scale bar represents nucleotide substitutions per site. Panel colors correspond to SMGC class (see legend). Panels are labeled with the SMGC cluster membership (see Table S3) defined using our annotation-independent approach (see Materials and Methods).

