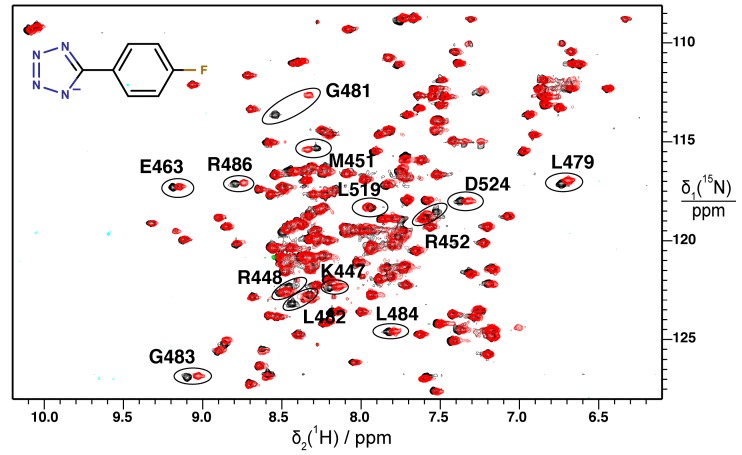
Figure 1.
Superimposition of 15N–1H HSQC spectra of DnaGC. The protein spectrum in the absence of fragment in black is compared with its spectrum after addition of fragment 4 (structure shown) in red. Representative assignments of resonances that showed the highest weighted chemical shift perturbation (CSP) (Figure S3d) are shown.

