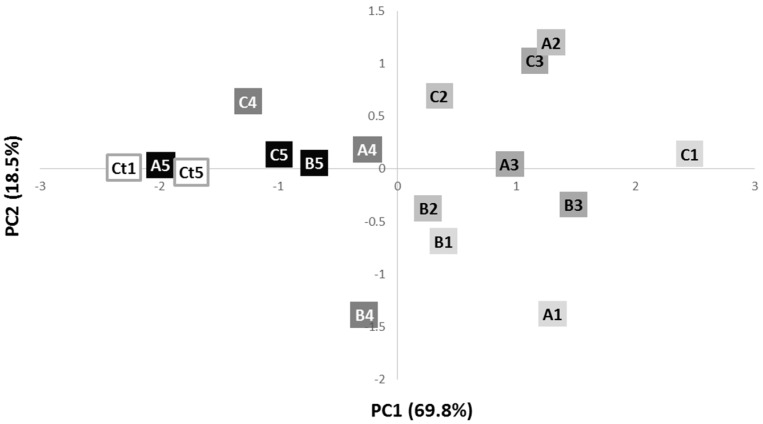
Figure 2.
Scores scatter plot of the IR spectra of phage-resistant colonies A, B and C, along the 5 streak plating steps, and control phage sensitive colonies after 1 (Ct1) and 5 (Ct5) streaking steps. The letters correspond to the different colonies (A is colony A; B is colony B; C is colony C) and the numbers to the streaking-plate days (1 is day 1; 2 is day 2; 3 is day 3; 4 is day 4; 5 is day 5).

