
Extended Data Figure 9. Integration sequencing analysis of engrafted myeloid cells, B cells, and T cells from two individual animals.
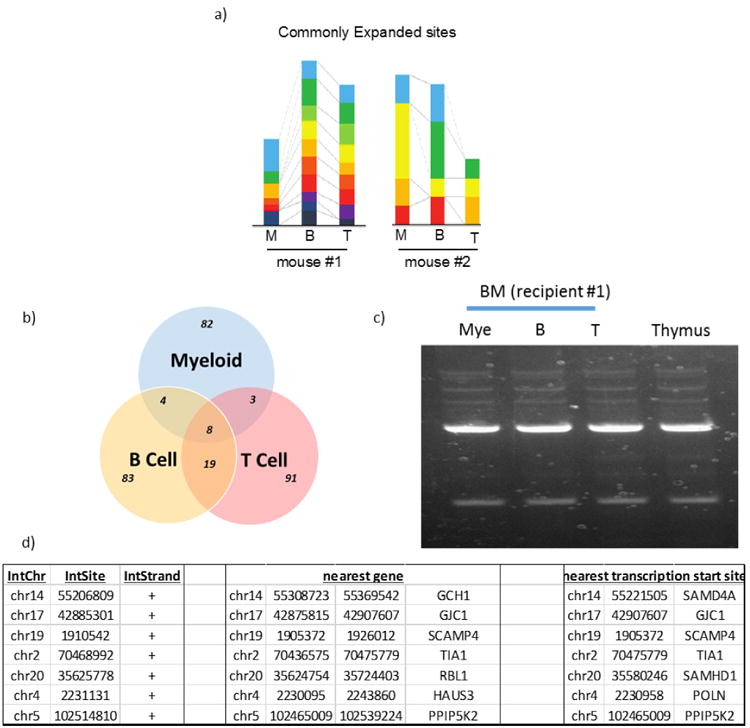
a, Left: from 8 weeks, indicated in Fig. 2b; right: from 5 weeks. Clonally expanded populations are shown for each lineage, with common clones among three lineages represented by colour. The smallest proportional coloured segments for each animal represent the unit value of two clonal sequences. b, Overlap of commonly expanded integration sites from an animal shown on the left in a. Genomic DNA-sequencing of CD33+ myeloid cells, CD19+ B cells, and CD3+ T cells from bone marrow detected common expanded integration sites. c, Agarose gel electrophoresis of adaptor-ligation of engrafted cells. Cells were obtained independently from those used in a at the 1 week time point. d, Integrated loci mapped in genome. Nearby genes of common integrated sites are described. These data are from an animal indicated in a at the 8 week time point.