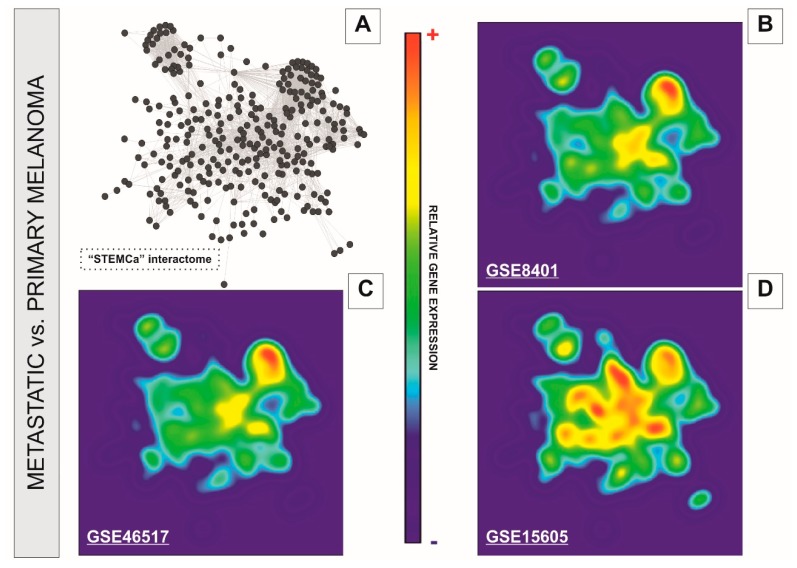
Figure 3.
GALANT plots over the in silico model “STEMCa” in melanoma metastasis from three independent sample sources from GEO. The figure represents the relative gene expression over the “STEMCa” interactome (A) in melanoma metastasis vs. primary melanoma analyzed in (B) GSE8401, (C) GSE46517, and (D) GSE15605 independent microarray samples, by using the GALANT software, which is an open-source application able to build landscape maps of gene expression networks.

