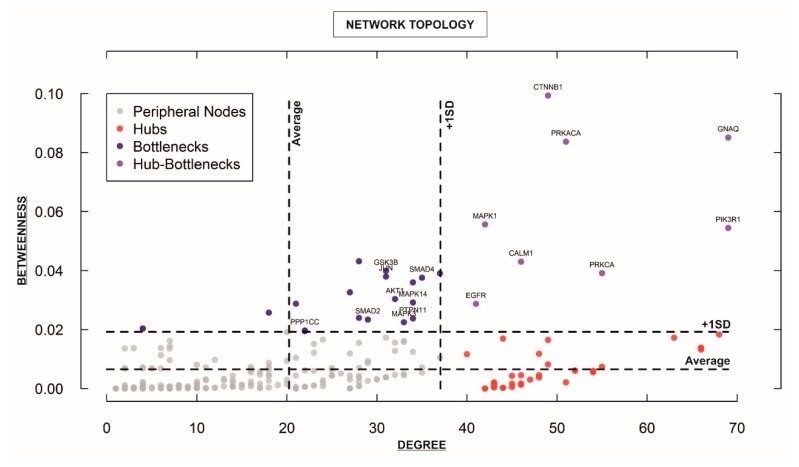
Figure 4.
Analysis of the topological properties (betweenness vs. degree) of genes/proteins belonging to the “STEMCa” interactome. The figure identifies only central nodes, hub-bottlenecks and nonhub-bottlenecks with values above +1 SD of the mean, which are differentially expressed (corrected p-values < 0.05) in at least one GSE, which is the unique and stable GEO accession number assigned for each series record or group of related samples, it is the ID from GEO for the analyzed datasets from the re-analyzed cohorts (GSE8401, GSE46517, and GSE15605).

