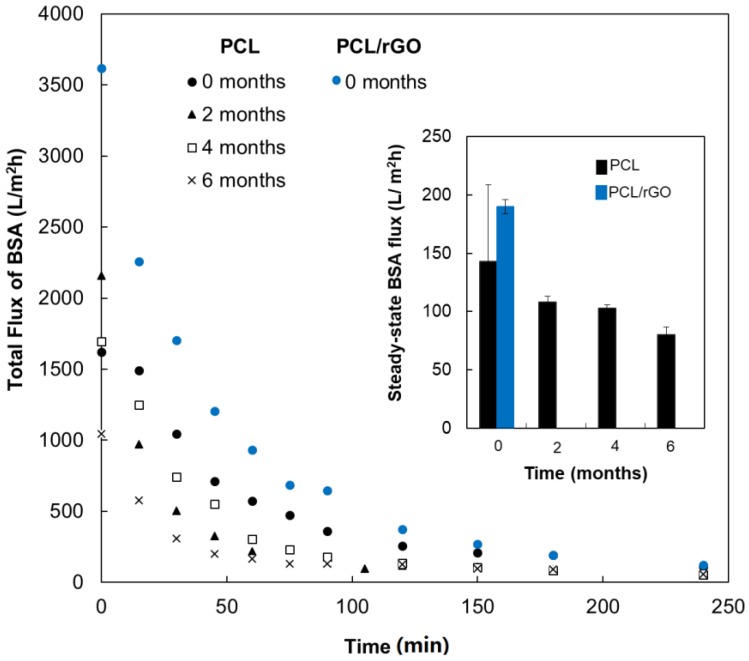
Figure 2.
Total flux decay of BSA model solution of average values of PCL membranes during 240 min at different times of degradation. Flux data for PCL/rGO membrane at t = 0 months were also included (deviation bars not shown for the shake of clarity). Inset shows the values of BSA solution flux at steady state for PCL and PCL/rGO membranes at 0, 2, 4, and 6 months of degradation.

