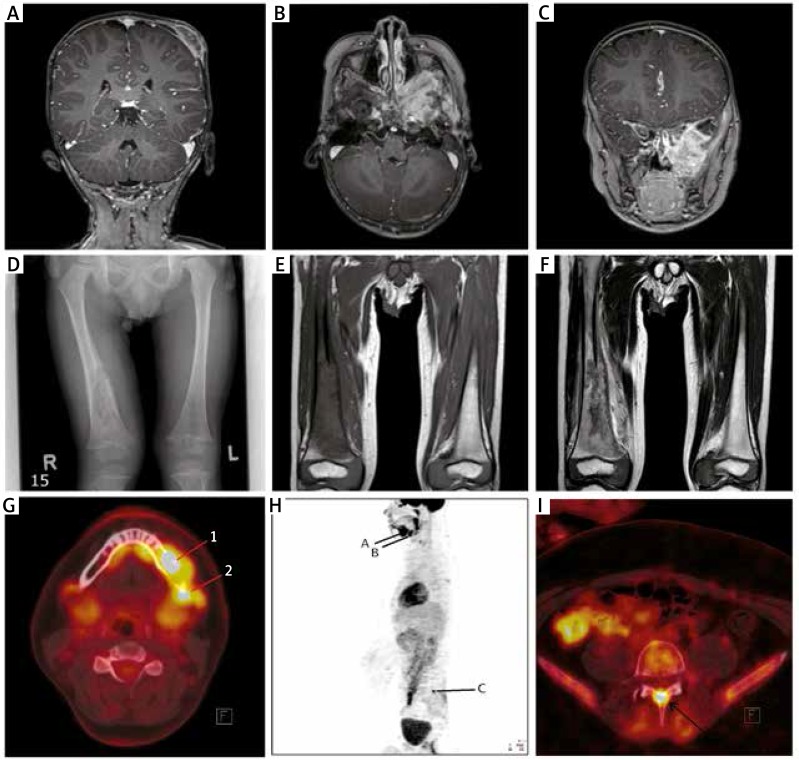
Figure 1.
A – Magnetic resonance imaging (T1-weighted image) after contrast administration – osteolytic lesion of the parietal bone with soft tissue involvement. B – Magnetic resonance imaging (T1-weighted image) after contrast administration – extensive infiltration of the skull base (left side), horizontal projection. C – Magnetic resonance imaging (T1-weighted image) after contrast administration – extensive infiltration of the skull base (left side), vertical projection. D – X-ray, PA – osteolytic focus of the right femur with interruption of cortical layer and periosteal reaction. E – Magnetic resonance imaging (T1-weighted image) in the frontal plane – destruction of the distal shaft of the right femur. F – Magnetic resonance imaging (T2-weighted image) in the frontal plane – destruction of the distal shaft of the right femur. G – PET-CT FDG and CT fusion image – hypermetabolic mass in the left side mandible with the bone lesion (SUVmax 15.9) (1) and involved submandibular hypermetabolic lymph nodes (SUVmax 11.3) (2). H – WB FDG-PET scan in lateral projection showing hypermetabolic activity on the left side of the mandible (A) and adjacent lymph nodes (B), as well as in the arch of L5 (C). I – FDG-PET and CT fusion image with a hypermetabolic mass in the arch of L5, which resulted in a bone lesion (SUVmax 11.4)

