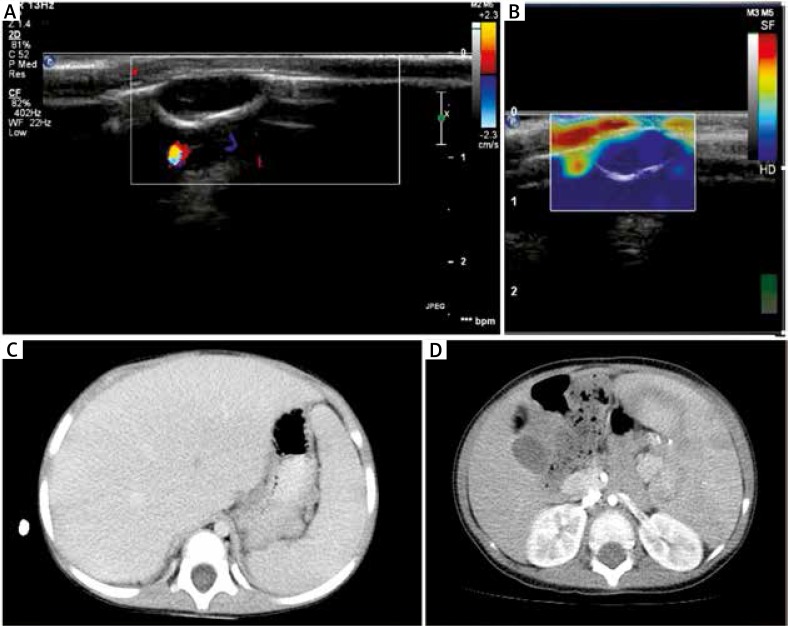
Figure 2.
A – Ultrasonography (1HX1 elastography) of the intraosteal cyst of the temporal bone with no visible features of bone destruction. B – Ultrasonography (1HX1 elastography) of a solid lesion in the right parietal area with bone destruction. The blue colour corresponds to a hard lesion, and the image suggests a proliferative process. C – Computed tomography (CT) of the abdomen – hepatomegaly. D – Computed tomography (CT) of the abdomen – splenomegaly

