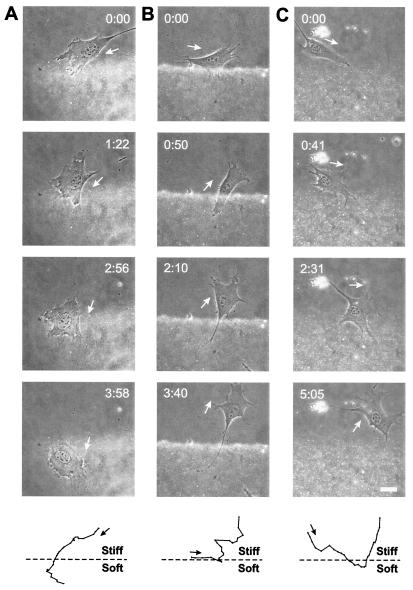
Figure 4.
Movements of cells on substrates with a rigidity gradient. Images were recorded with simultaneous phase and fluorescence illumination. Fluorescent beads embedded in the soft part facilitate the detection of the rigidity boundary. A FAK-null cell (A) approached the rigidity boundary from the hard side and moved into the soft side of the substrate. In contrast, cells expressing WT-FAK (B) or F397-FAK (C) reversed the direction of migration as part of the cell entered the soft substrate. (Bottom) Paths of these cells plotted every 10 min over a period of 3 h. Bar = 40 μm.

