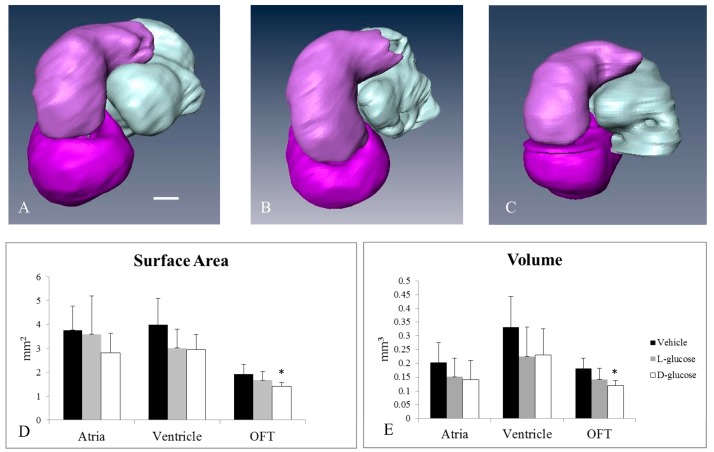
Figure 4.
Micro-CT analysis of HH24 hearts reveals differences in endocardial OFT properties in response to hyperglycemia. Representative, reconstructed micro-CT images of the atria (white), ventricle (dark purple), and OFT (light purple) for a vehicle control (A), an osmotic control (B), and a d-glucose-treated embryo (C). The average surface area (D) and volume (E) for the heart sections. Scale bar = 100 µm. * p < 0.05 ANOVA.

