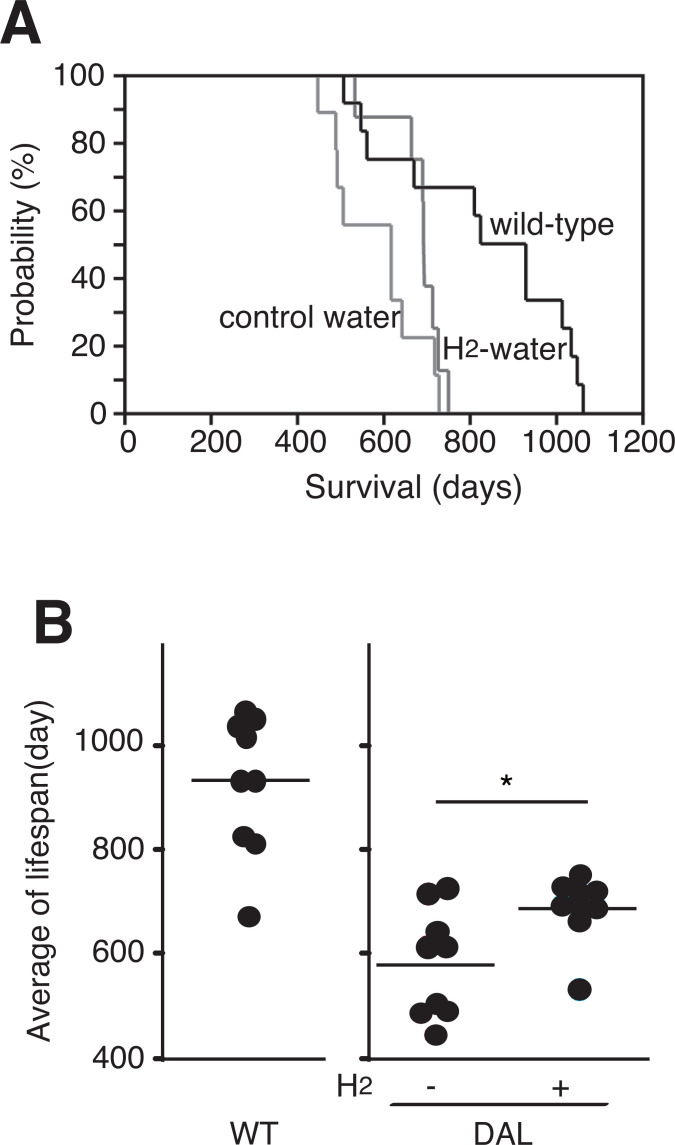
Fig. (3).
Extension of the average lifespan by continuous drinking H2-water. (A) Kaplan-Meier curve representing the survival of female C57BL/6 mice (wild-type), female DAL101 mice drinking control water (control water) and H2-water (H2-water). (B) Each dot indicates the lifespan of each mouse. The bars indicate the average lifespan of each group. *p < 0.05 (p = 0.036) by Student’s t-test.

