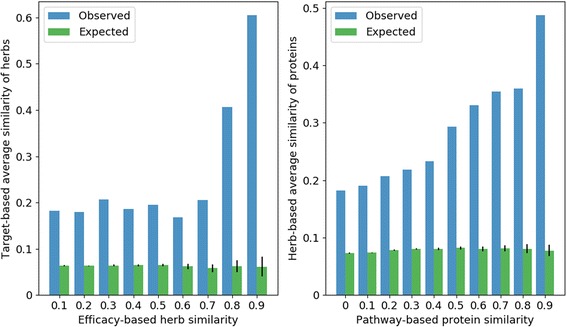
Fig. 3.

Overlap analysis of herb pairs and protein pairs. Figure 3a Herb pairs with shared efficacies imply shared proteins. The horizontal axis represents efficacy-based similarity bins of herb pairs, and the vertical axis represents target-based average similarity of herb pairs under the corresponding efficacy-based herb similarity bins. The mazarine and green bar represent observed results and expected results of random permutation. Figure 3b Protein pairs with shared pathways imply shared targeted herbs. Similarly, the horizontal and vertical axis represent pathway-based similarity of protein pairs and herb-based average similarity of protein pairs under the corresponding bins
