. 2017 Nov 15;9(3):735–742. doi: 10.1039/c7sc04312k

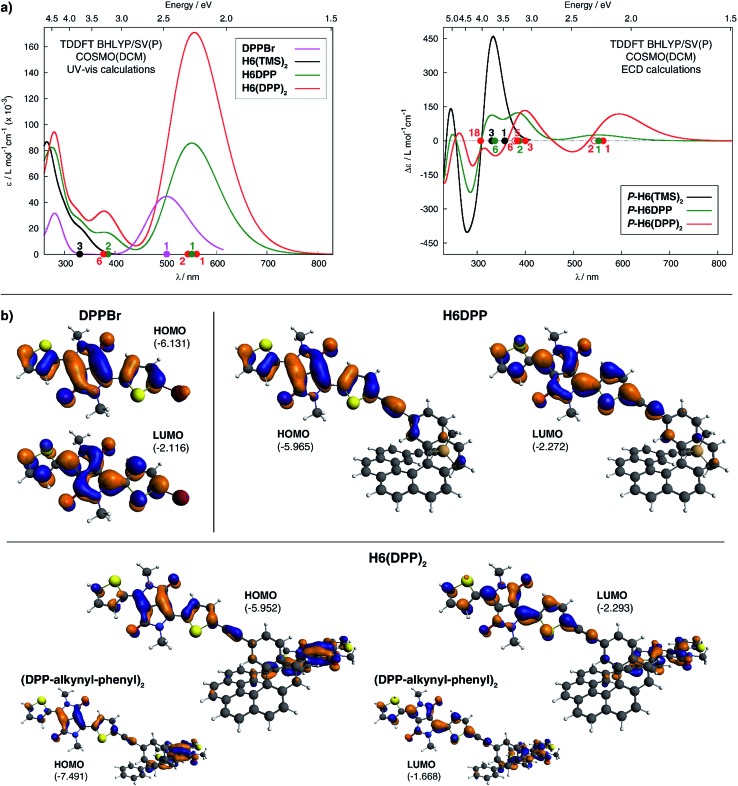
Fig. 4. Panel (a): comparison of the simulated UV-vis (left) and ECD (right) spectra of H6DPP and H6DPP2 with H6(TMS)2 and DPPBr. H6DPP and H6DPP2 spectra shown have been Boltzmann-averaged (25 °C) for conformers presented in Fig. 3. No spectral shift has been applied. Selected excitation energies have been indicated by dots on the abscissa. Filled/unfilled dots in the ECD spectra indicate positive/negative rotatory strength value. Panel (b): isosurfaces (±0.04 au) of frontier MOs for DPPBr, H6DPP (conformer I) and H6(DPP)2 (conformer I). The corresponding MOs for (DPP–CC–Ph)2 model for the exciton coupling have been inserted for comparison. Values listed in the parentheses are orbital energies, in eV.

Fig. 4