
Fig. 5.
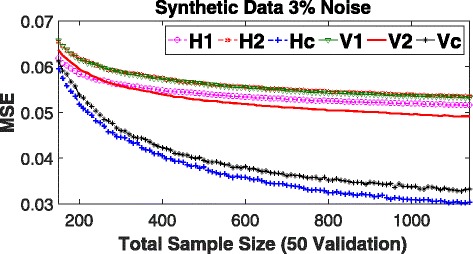
Mean Square Error (MSE) on Synthetic Data with increasingly large training sample sizes. H1, H2, V1, and V2 are individual RF models built using the template in Fig. 2. Hc and Vc are horizontal and vertical stacking models, respectively, built with their corresponding individual models. MSE shown is the average over 100 replicates