
Fig. 3.
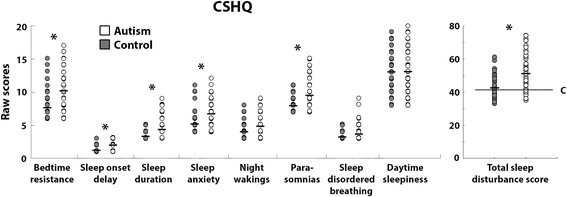
Scatter plots of CSHQ scores. Specific subscales (left) and total sleep disturbances (right) are presented for children with autism (white) and controls (gray). Each circle represents a single child. Black lines indicate group mean. Asterisks indicate significant differences across groups after Bonferroni correction (p < 0.006). C indicates the cutoff line that is often used when screening children for clinical sleep problems [27]