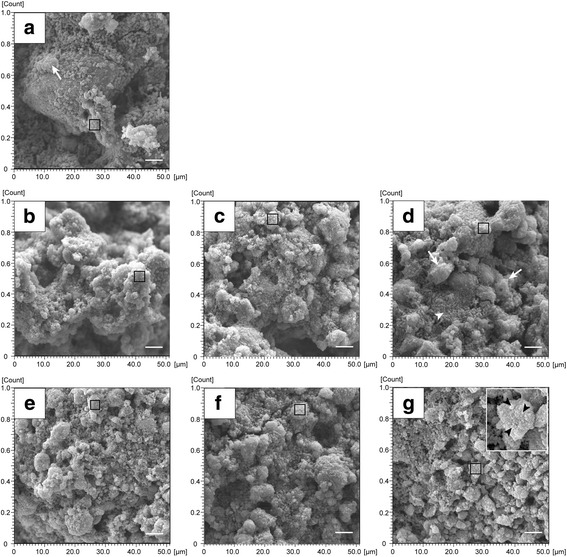
Fig. 4.

Representative SEM images in the mineral uptake phase. Figure shows DW treatment with calcifying solution for 0, 12, 24, and 48 h (a–d) and CHG treatment with calcifying solution for 12, 24, and 48 h (e–g). White arrow heads indicate microorganisms, and white arrows show EPS-like structures. Calcium phosphate-like particles were seen, especially on the surface of the biofilm after 48 h incubation (inset in g; higher magnification of the area indicated by a rectangle). Scale bars = 5.0 μm
