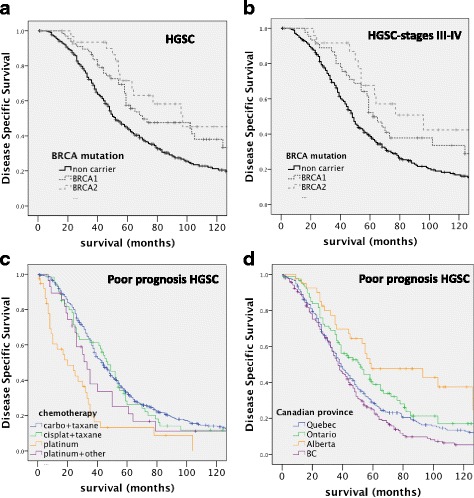
Fig. 3.

Kaplan-Meier survival curves of disease-specific survival stratified by BRCA status (a-d). a Comparison of HGSC patients by BRCA mutation. Mutation non-carriers (black, n = 351), BRCA1 mutation positive (dark grey, n = 67) and BRCA2 mutation positive (dashed light grey, n = 34). b Comparison of HGSC patients by BRCA mutation in advanced stage disease. Mutation non-carriers (black, n = 293), BRCA1 mutation positive (dark grey, n = 45) and BRCA2 mutation positive (dashed light grey, n = 26). c Kaplan-Meier survival curves of disease-specific survival stratified by chemotreatment type. Comparison of poor prognosis HGSC patients by chemo-treatment: carboplatinum/taxane (blue, n = 469); cisplatinum/taxane (green, n = 60); platinum alone (gold, n = 38); platinum + another agent (violet, n = 28). d Kaplan-Meier survival curves of disease-specific survival stratified by source site. Comparison of provincial origins of poor prognosis HGSC patients in the COEUR cohort (Quebec = 275, Ontario = 89, Alberta n = 41, British Columbia = 210). Significance (p) is indicated by log-rank
