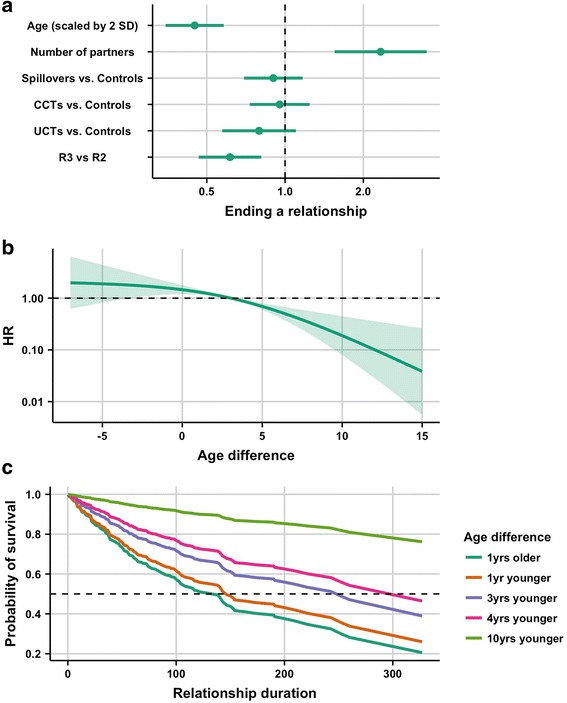
Fig. 6.

Results of Cox proportional hazards model for relationship duration. In this model age difference was represented with a spline. a. coefficient plot of hazard ratios for ending relationships (HR and 95% CI) for all non-spline terms in the model. b. predicted HRs for age differences, with the median (age difference = 3) as the reference. c. expected survival curves for selected age differences (2.5th, 25th, 50th, 75th and 97.5th percentiles)
