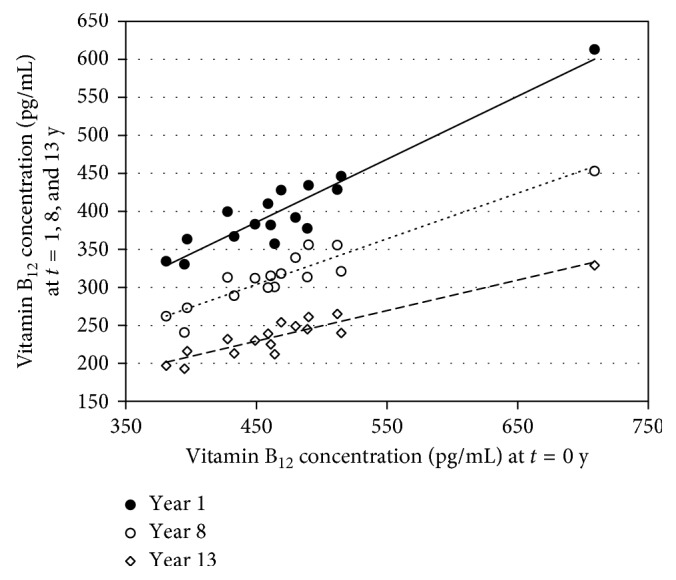
Figure 4.

Correlation between the mean vitamin B12 concentrations at t=0 and after storage for 1, 8, and 13 years at −70°C. The correlation lines have the following equations: y = 0.829x + 2.80
 , y = 0.600x + 33.7
 , and y = 0.401x + 48.5
 for 1, 8, and 13 years, respectively.
