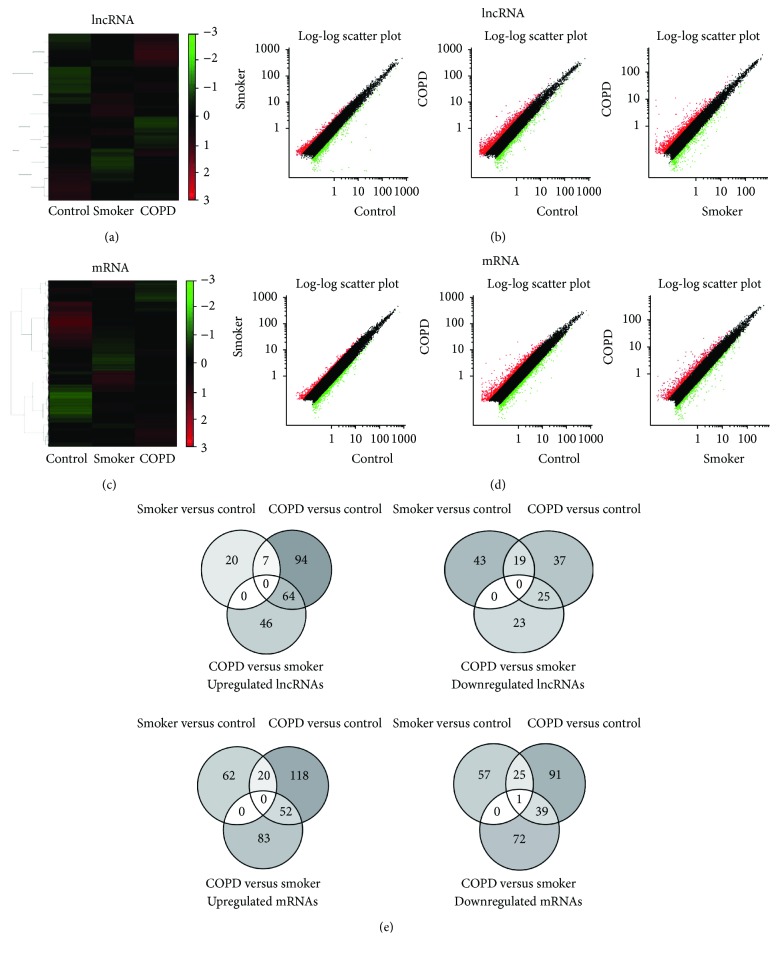
Figure 1.
Hierarchical clustering, scatter plot result, and Venn diagram of differentially expressed lncRNAs and mRNAs in PBMCs from nonsmokers, smokers, and COPD patients. (a) Hierarchical clustering image of lncRNA expression of pooled RNA samples from PBMCs. (b) Scatter plot of lncRNA expression of PBMCs. (c) Hierarchical clustering image of mRNA expression of pooled RNA samples from PBMCs. (d) Scatter plot of mRNA expression of PBMCs. Red and green colored dots represent up- and downregulated miRNAs in scatter plot, respectively. (e) Venn diagram of differentially expressed lncRNAs and mRNAs. Figure reproduced from Dang et al. [10], under the Creative Commons Attribution License/public domain.

