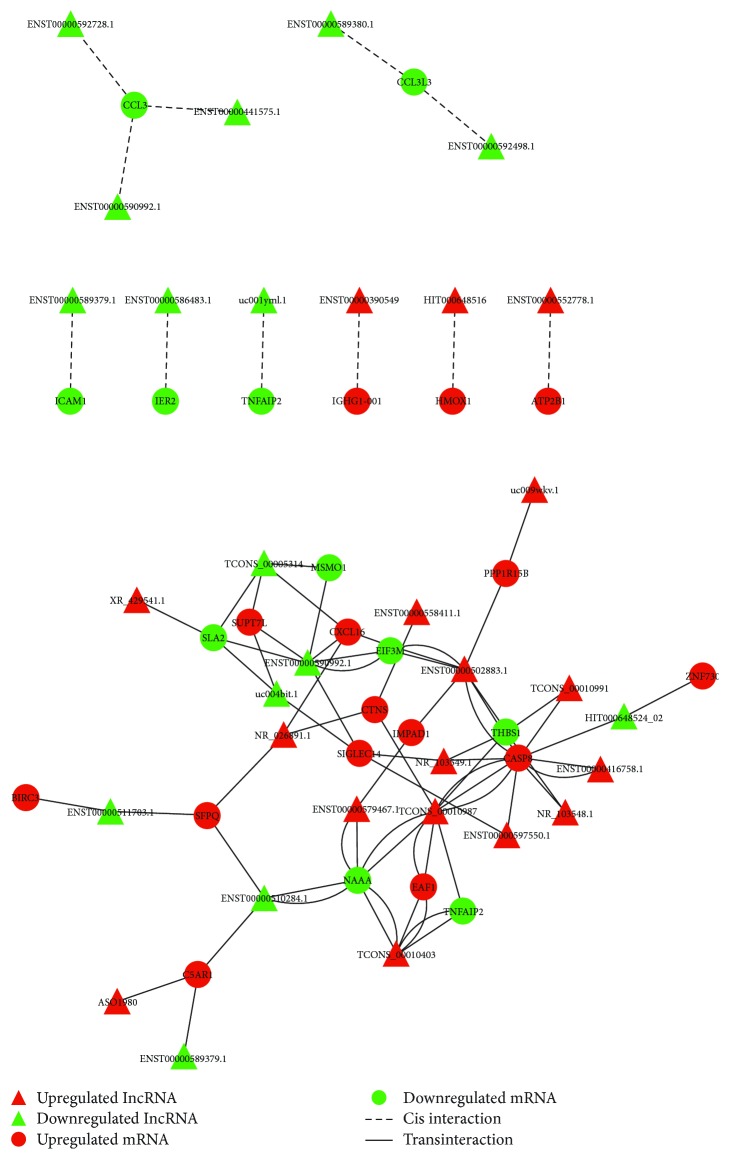
Figure 2.
Regulation network between lncRNAs and mRNAs. The regulation of lncRNA on dysregulated mRNAs was predicted and the regulation network was drawn by using Cytoscape software. Red and green color represents up- and downregulated genes, and triangle and circle shape represents cis- and transinteraction, respectively.

