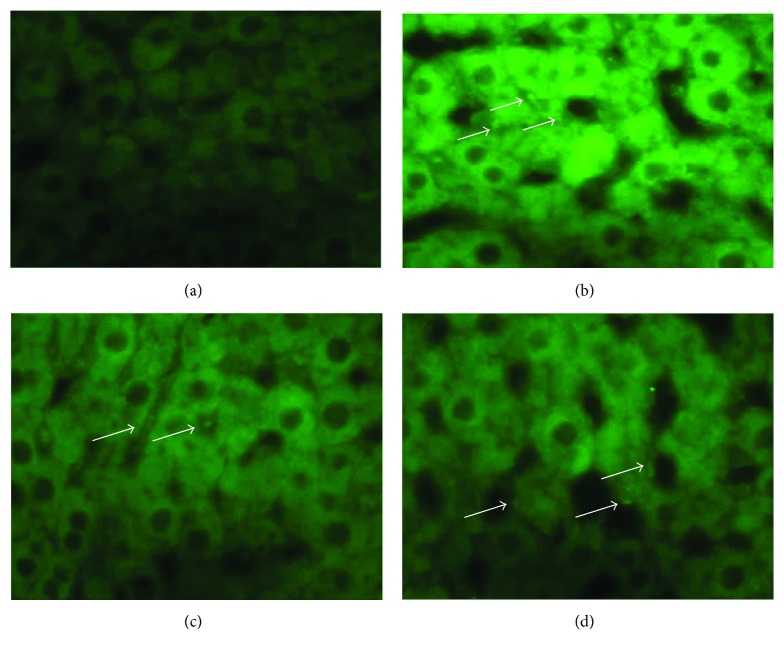
Figure 5.
(a–d) Fluorescent in situ hybridization (FISH) of the Y chromosome, with fluorescein stain used for nuclear staining. (a) Animal of the control group, in which no signals are present. (b) Localization of the intraportally transplanted ADSCs in the host liver on the 4th POD (as depicted by arrows). (c and d) Localization of the intraparenchymaly transplanted ADSCs in the host liver on the 7th and 15th POD, respectively (as depicted by arrows).

