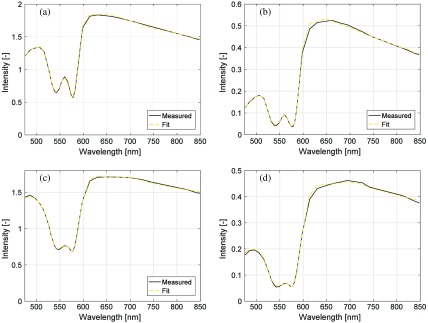
Fig. 4.
Examples of measured spectra and calculated spectra from best fit model at (a and b) 10 and 60 min in the first phantom, for source–detector separation (a and c) 0.4 mm and (b and d) 1.2 mm. At 10 min, the estimated compared to expected 99%, and estimated compared to expected 1.60%. Corresponding numbers at 60 min were 47%/58% and 1.46%/1.60% for and , respectively.

