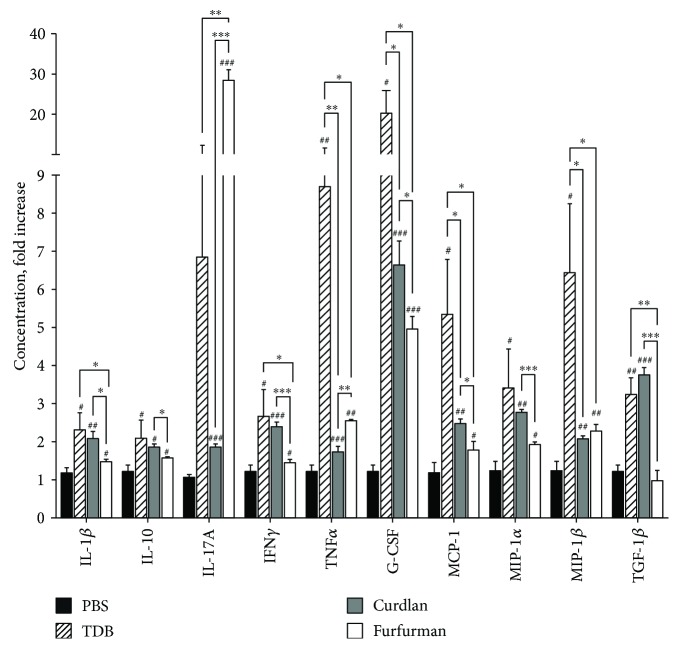
Figure 3.
Cytokine and chemokine expression in murine splenic mononuclear cells after Mincle, Dectin-1, and Dectin-2 stimulation. Splenic mononuclear cells were isolated from C57/Bl6 mice, seeded in 96-well plates at 2 × 10⁵ cells/well, and stimulated for 48 h with 10 μg/mL Mincle, Dectin-1, and Dectin-2 agonists. Cytokines were quantified in media by bead-based immunoassay. Data are mean fold change relative to PBS-treated cells in three independent experiments with duplicates, and error bars indicate standard deviations. Data were compared using the two-tailed unpaired Mann–Whitney t-test. # p < 0.05; # # p < 0.01; # # # p < 0.005 versus PBS-treated cells. ∗ p < 0.05; ∗∗ p < 0.01; ∗∗∗ p < 0.005 between Mincle-, Dectin-1-, and Dectin-2-stimulated cells.

