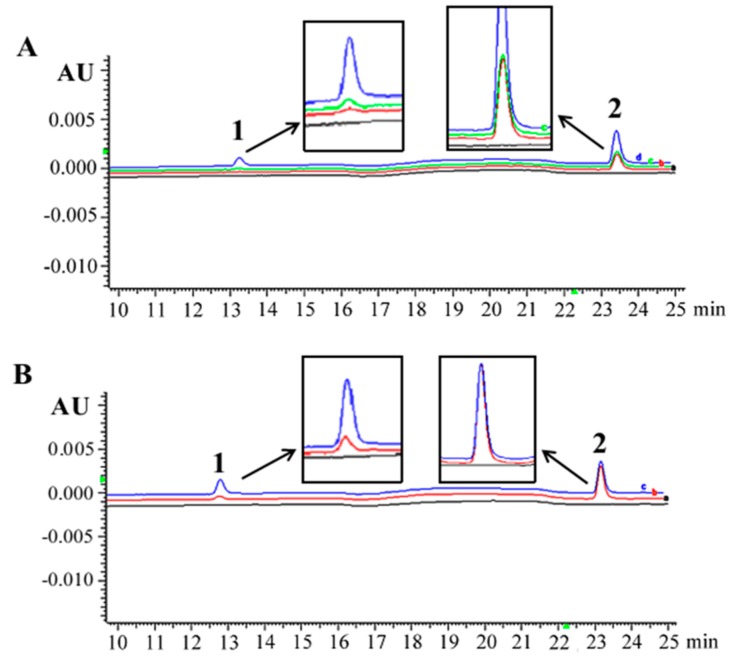
Figure 2.
Representative HPLC/DAD analysis of resveratrol in rat thyroid tissue samples and THJ-16T thyroid cancer cells. (A) HPLC/DAD chromatograms of normal rat thyroid tissue (black line), thyroid tissue obtained from the rat 30 min after 20 mg/kg resveratrol injection through IG (red line) and IP (green line), normal rat thyroid tissue spiked with 1.0 μM resveratrol and internal standard/IS (blue line); (B) HPLC/DAD chromatogram of control cell lysates (black line), cells treated with 100 μM resveratrol for 60 min (red line), and control cell lysates spiked with 1.6 μM resveratrol and internal standard/IS (blue line). Peaks: 1. trans-resveratrol; 2. 1,8-dihydroxyanthraquinone (IS).

