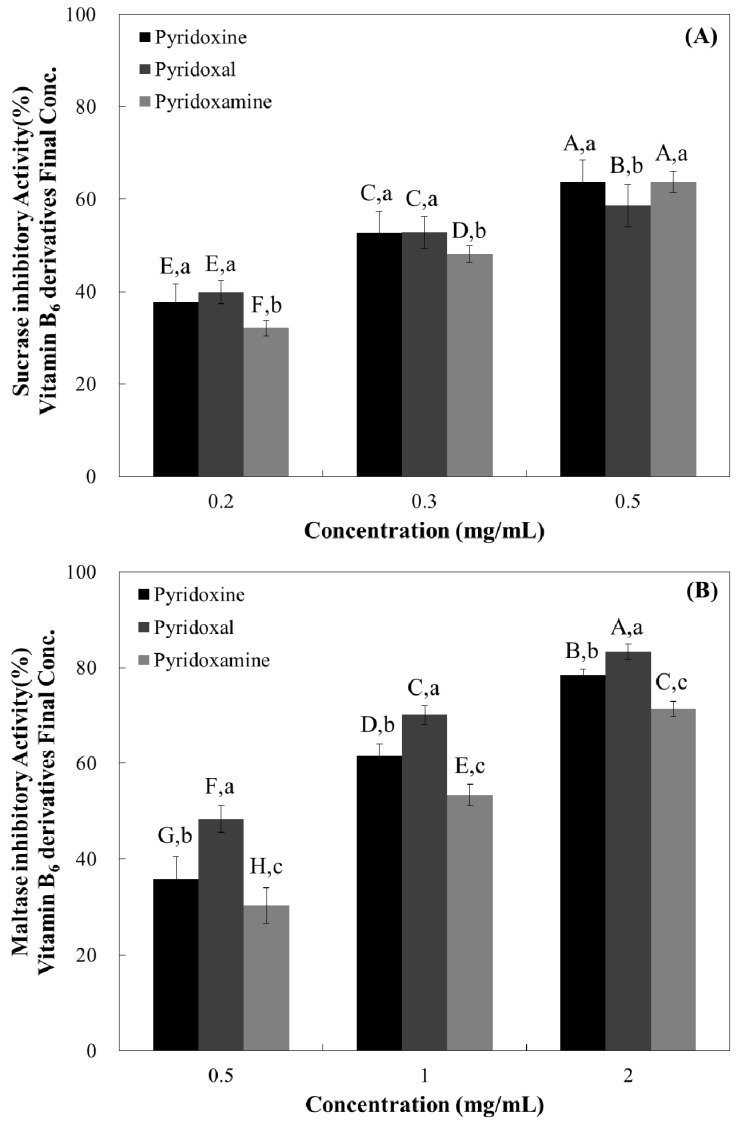
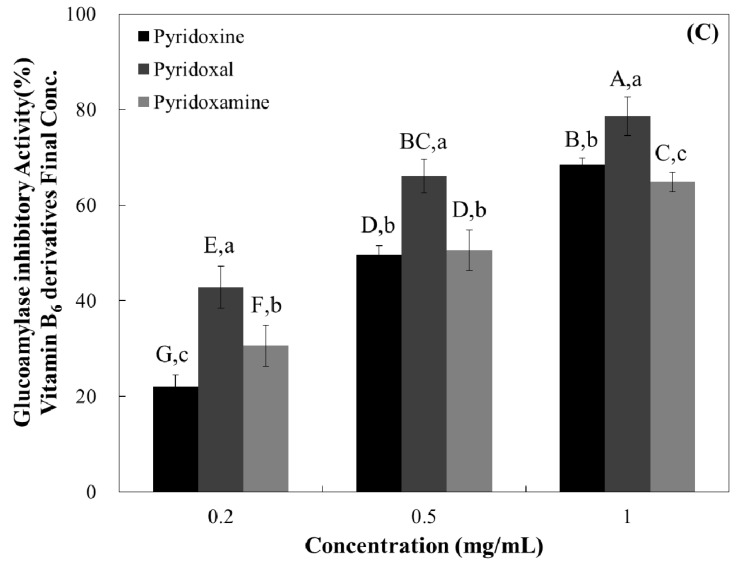
Figure 3.
Dose-dependent changes in rat intestinal α-glucosidases such as sucrase (A); maltase (B); and glucoamylase inhibitory activities (C) (% inhibition) of pyridoxine, pyridoxal, and pyridoxamine. The results are expressed as mean ± S.D. with three independent experiments in triplicate. Different corresponding letters indicate significant differences at p < 0.05 by Duncan’s test. The first letters in uppercase (A–H) indicate significant differences among all samples. The second letters in lowercase (a–c) are different among types of vitamin within the same concentration.


