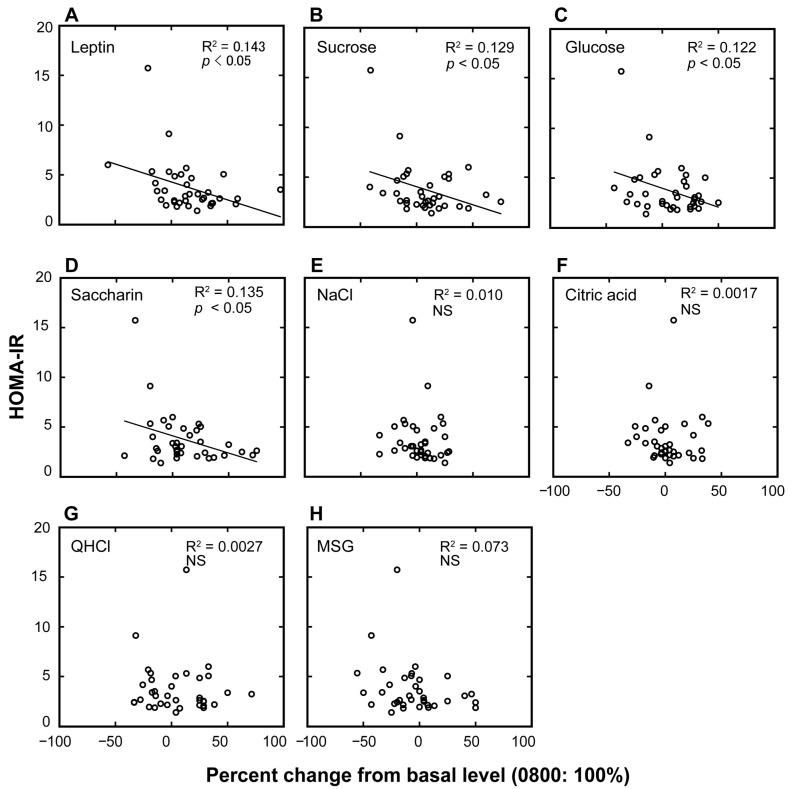
Figure 2.
Association plots between the homeostatic model assessment of insulin resistance (HOMA-IR) values and the percent changes in plasma leptin levels and taste recognition thresholds. Association plots between HOMA-IR scores and percent changes in plasma leptin levels (A) and taste recognition thresholds for seven different taste stimuli (B–H) at 10:00 p.m. compared with the basal values collected at 8:00 a.m. (control = 100%) in overweight and obese individuals. Each circle represents a single individual subject. Linear regression analysis was used to obtain the coefficient of determination (n = 36). NS, not significant.

