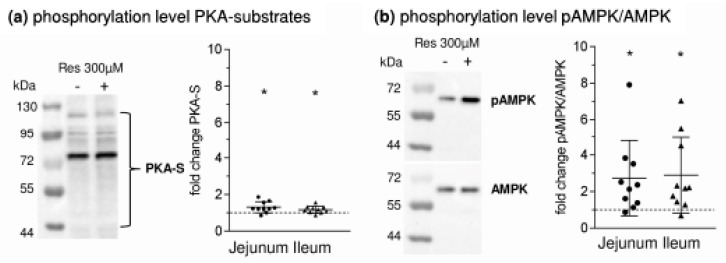
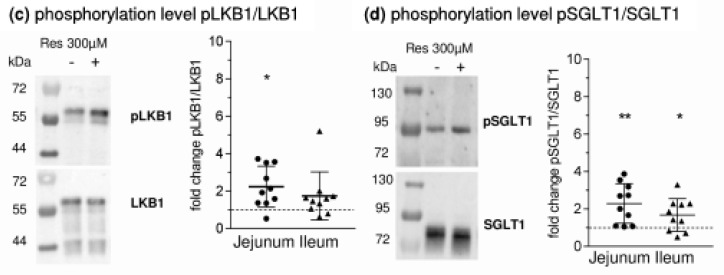
Figure 5.
Changes in the phosphorylation levels of (a) PKA substrates (b) AMPK (c) LKB1 (d) SGLT1 after incubation with Resveratrol (300 µM, mucosal). One exemplary Western blot is shown together with the relative changes when setting the phosphorylation levels of control samples at 1. MW ± SD (n = 10), tested against 1 using one sample t-tests. * p ≤ 0.05, ** p ≤ 0.01.


