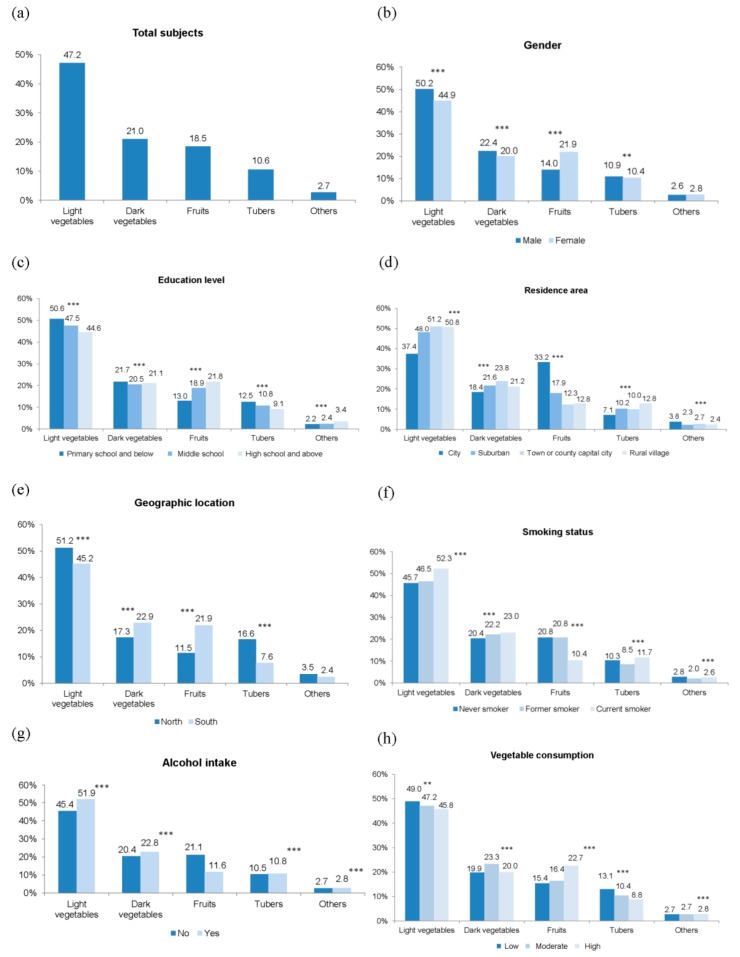
Figure 1.
Contribution percentage of food sources to the total vitamin C intake by sociodemographic factors. (a) Total subjects; (b) subgroups by gender; (c) educational level; (d) residence area; (e) geographic location; (f) smoking status; (g) alcohol intake; (h) vegetable consumption. ** p < 0.01, and *** p < 0.001 indicate significant differences in the distribution of the contribution percentages of food sources to the total vitamin C intake by sociodemographic factors by Wilcoxon rank-sum test or Kruskal-Wallis analysis.

