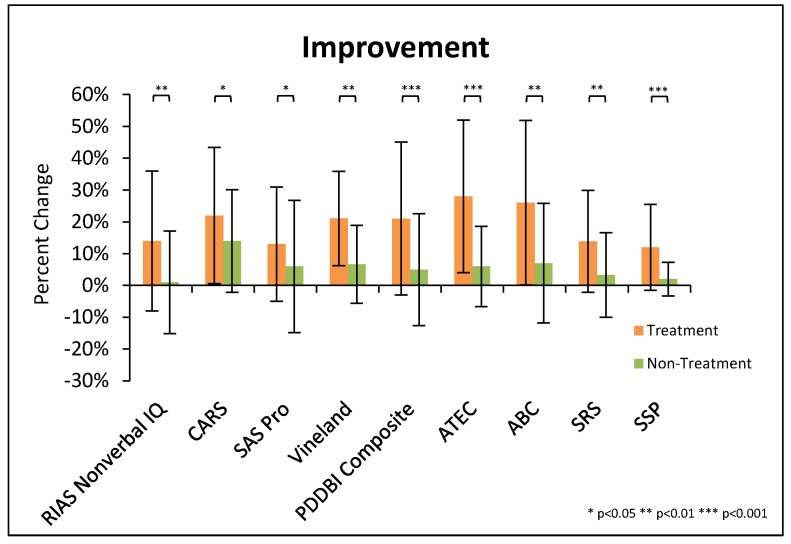
Figure 2.
Summary of significant changes in major evaluations, for both the treatment and non-treatment groups. For some scales an increase is an improvement, and for some the opposite is true; so, here we plot them with improvement being in the same direction on the y-axis. Note that the % change for the PDD-BI composite is based on the average change in each of the composite subscales. Error bars represent standard deviations.

