
Figure 2. Quantification of retrograde transport efficiency.
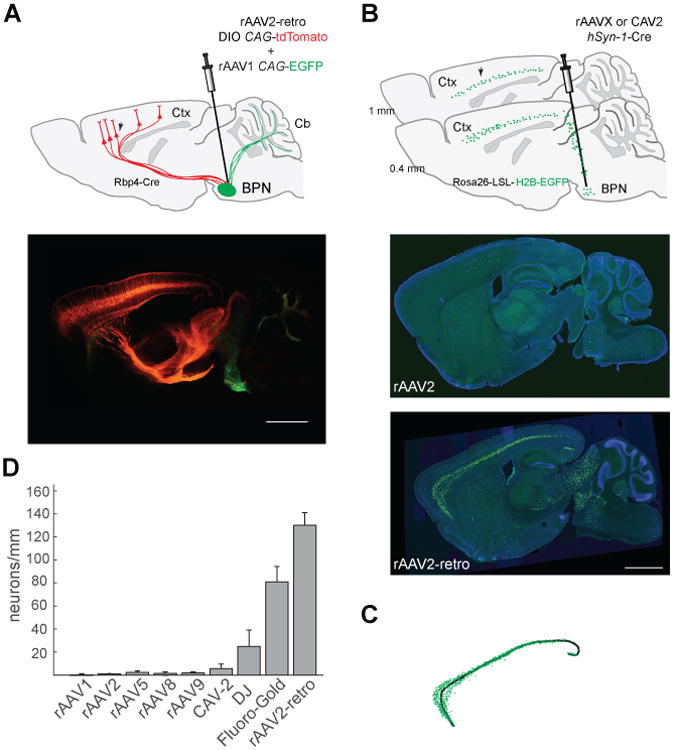
(A) Efficient labeling of the corticopontine tract throughout the rostro-caudal axis via basal pontine injection of rAAV2-retro-DIO-CAG-tdTomato in a layer V-specific Cre mouse line (Rbp4_KL100 Cre). Top panel: schematic of the experiment. Injection site was marked by co-injecting rAAV1-CAG-EGFP. BPN: Basal pontine nuclei. Bottom panel: unamplified tdTomato and EGFP expression three weeks after injection. Scale bar: 1 mm. (B) Quantification assay design. Top panel: schematic of the experiment. Corticopontine labeling was assessed in sagittal sections lateral to the injection tract (∼1 mm lateral with respect to midline) taken from Rosa26-Lox-STOP-Lox-H2B-EGFP animals injected in the BPN with various AAV serotypes carrying Cre recombinase transgene. Arrow indicates expected nuclear GFP labeling in cortical neurons of the corticopontine tract. Middle panel: representative image of an rAAV2-injected brain. Bottom panel: representative image of rAAV2-retro-injected brain. Scale bar for both the panels: 1 mm. (C) Schematic of the semi-automated quantification procedure. Fluorescent nuclei (green) were automatically detected and counted along a manually drawn line that traced the length of cortical layer V (black). (D) Retrograde transport efficiency for different AAV serotypes and for canine adenovirus type 2 (CAV-2) (See Experimental Procedures). Error bars represent the S.E.M. See also Figures S2 and S3.