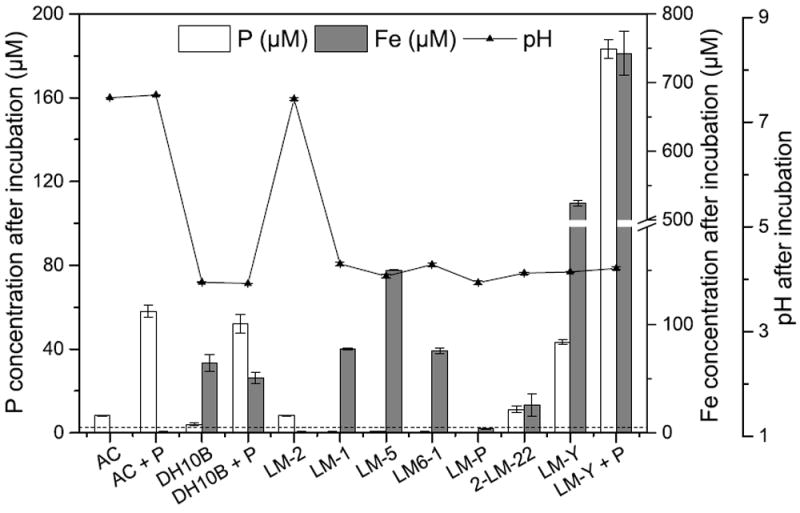
Figure 2. Growth of isolates with HFO-P as the only P source.

Both P (white bars) and Fe (gray bars) are released from the minerals by all strains, and all strains except LM-2 lower the pH to ~4. Samples for pH, Fe, and P quantification were taken after 6 days’ incubation and were averages of 2 biological replicates; error bars indicate standard deviations between biological replicates. The limits of detection for P and Fe are 2.45 μM and 0.08 μM, respectively. The limit of detection of P is indicated by the dashed line. AC = Abiotic control; DH10B = E. coli strain DH10B. Columns annotated with “+P” had both HFO-P and 0.2 mM K2HPO4 in the solution.
