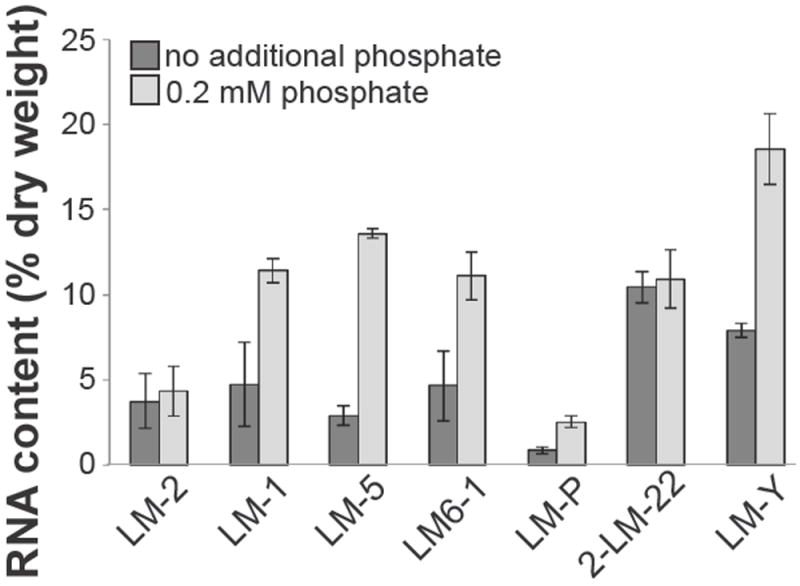
Figure 5. RNA contents of heterotrophic bacteria grown with 0.2 mM (light gray bars) and <2.45 μM (dark gray bars) phosphate.

Values reported are the amount of RNA per cell as a percentage of cellular dry weight and are the averages of two independent experiments.
