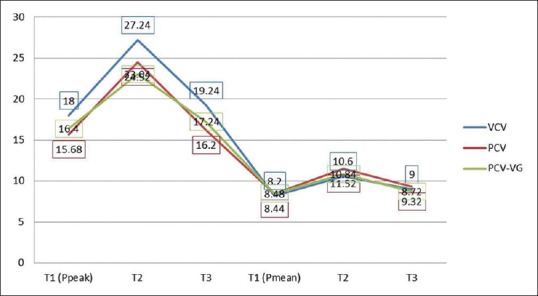
Figure 2.

Peak and mean pressures by modes of ventilation. VCV=Volume control ventilation, PCV=Pressure control ventilation, PCV-VG=Pressure-Controlled volume guaranteed ventilation. The data are listed as mean ± standard deviation. T1-After Intubation, T2-15 Min after insufflation of Co2, T3-15 min after desufflation
