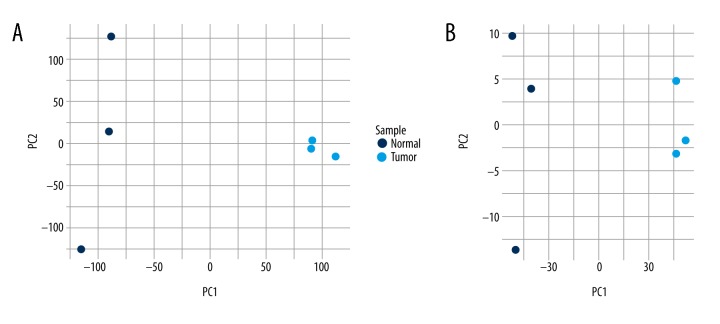
Figure 2.
The principle component analysis on the microarray data. (A) Principal component analysis (PCA) was performed on the differentially expressed circRNAs retrieved by the microarray data. The tumor samples are separated from the normal samples. (B) PCA plot of the 1221 differentially expressed mRNAs (FDR ≤0.05, FC ≥2). FC: fold change; FDR: false discovery rate.

