Figure 3.
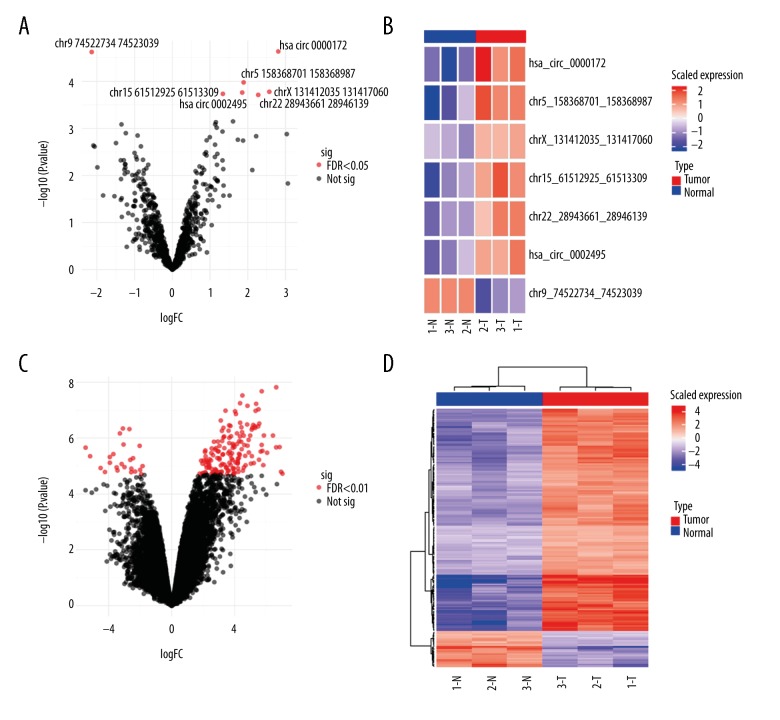
Volcano plots and hierarchical clustering analysis of the differentially expressed circRNAs and mRNAs. (A) The volcano plot of the differentially expressed circRNAs (FDR <0.05). The 7 differentially expressed circRNAs are labeled in the plot. (B) Hierarchical clustering analysis of the differentially expressed circRNAs. The identities of the 7 significantly differentially expressed circRNAs are shown on the right of each row. Some circRNAs are unnamed and tentatively annotated here using the format “chromosome_start position_end position”. T – tumor samples, N – normal samples. (C) The volcano plot of all the differentially expressed coding mRNAs from the microarray (FDR <0.01). (D) Hierarchical clustering analysis of the differentially expressed coding mRNAs. T – tumor samples; N – normal samples; FC – fold change; FDR – false discovery rate.

