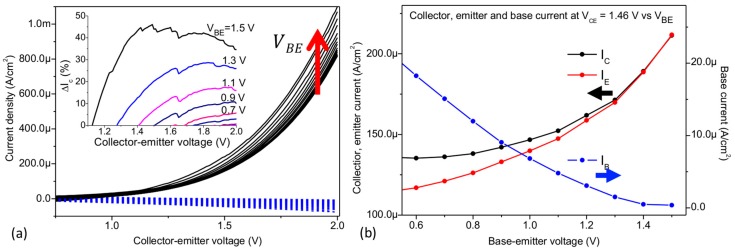
Figure 6.
(a) Base (blue dashed lines) and collector (black solid lines) current versus at constant values of ranging from 0 to 1.5 V in 100 mV steps. Inset: Percentage increase of in function of in respect to at 0 V. (b) Variation of the collector, emitter and base currents extracted at 1.46 in function of the graphene base voltage.

