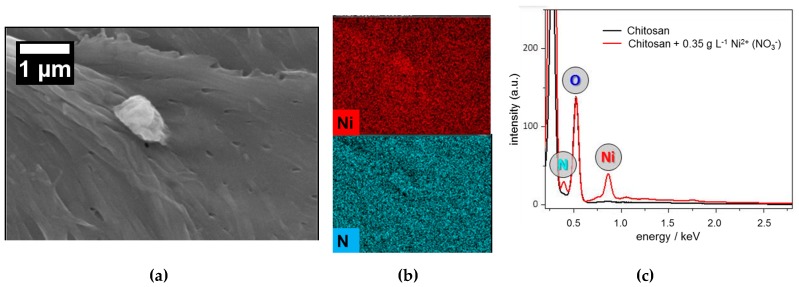
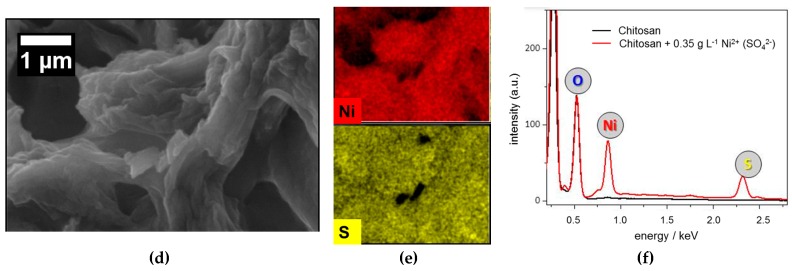
Figure 7.
SEM micrographs of the surfaces of chitosan flakes, (a) after adsorption of nickel from nickel nitrate solution with (b) the corresponding elemental distribution images of nickel and nitrogen and; (d) after adsorption of nickel from nickel sulfate solution with (e) the corresponding elemental distribution images of nickel and sulfate; (c,f) show the EDX spectra of natural chitosan surface and chitosan surface after adsorption of nickel from nickel sulfate and nitrate solution, respectively. In both cases initial concentration of nickel was 350 mg·L−1 and contact time amounted to 24 h.


