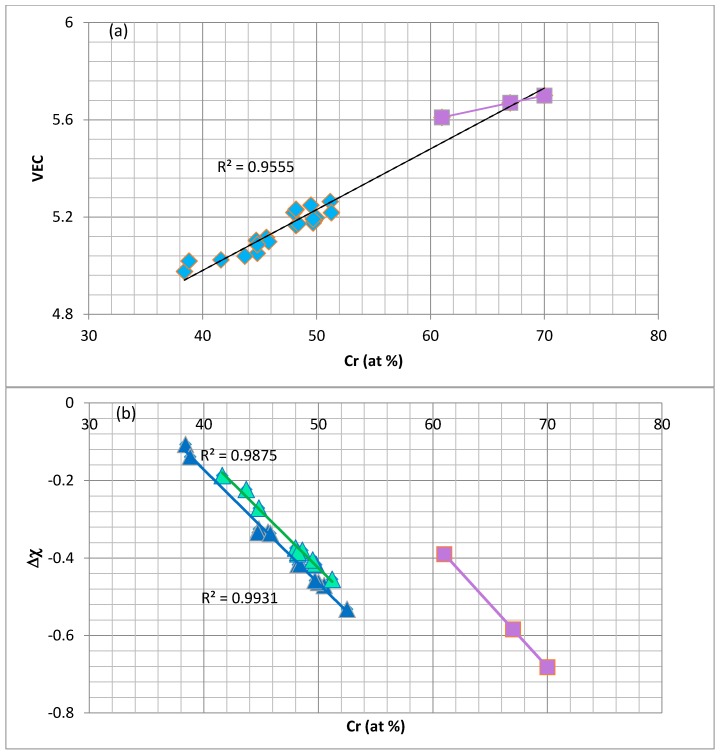
Figure 1.
Valence electron concentrations (VEC) (a) and ∆χ (b) versus the Cr concentration in the C14 NbCr2 Laves phases. The squares represent the unalloyed NbCr2. In (a) the blue diamonds correspond to the same data as in (b). In (b), the data can be separated: the blue triangles represent Laves phases where Nb is substituted by Ti, Mo or Hf, and Cr is substituted by Si, Sn or Al, and the green triangles represent Nb, substituted by Ti and Hf, and Cr by Si, Al, Ge or Sn.

