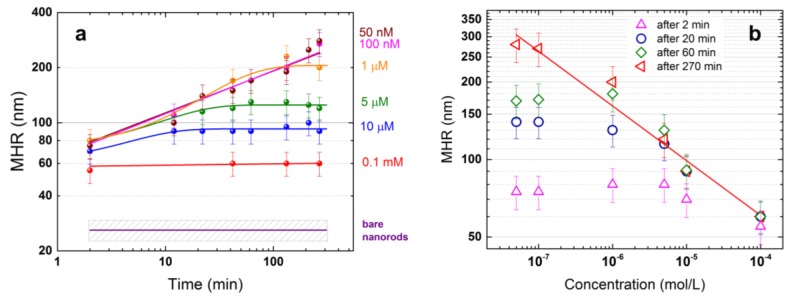
Figure 3.
(a) Mean hydrodynamic radius (MHR) of BIO-NRCs as a function of time at BSA concentrations of 0.1 mM (red dots), 10 µM (blue dots), 5 µM (green dots), 1 µM (orange dots), 100 nM (pink dots) and 50 nM (brown dots). The solid colored lines are fits of the experimental data using a model . Best fit parameters are: = 70 ± 20 nm, = 140 ± 20 nm, = 45 ± 20 min (orange line, 1 µM); = 72 ± 7 nm, = 53 ± 7 nm, = 11 ± 3 min (green line, 5 µM); = 60 ± 10 nm, = 35 ± 10 nm, = 5 ± 3 min (blue line, 10 µM). The purple line represents the MHR measured on the CTAB-coated pristine NRs. Data at 100 nM and 50 nM are fitted with a power law with for both concentrations (pink and brown lines). (b) MHR as a function of protein concentration after 2 min (pink triangles), 20 min (blue circles), 60 min (green diamonds) and 270 min (red triangles) from the mixing. (red line) Power law fit of the data. Best fit exponent −0.21 ± 0.02.

