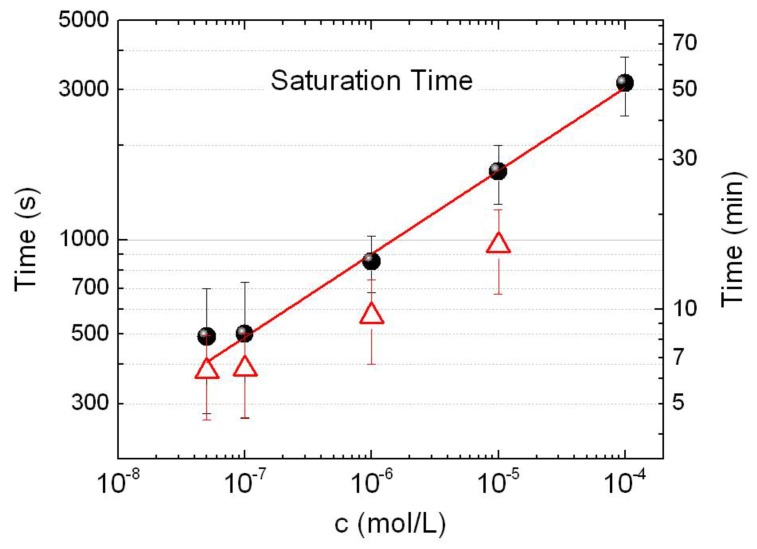
Figure 5.
Saturation time (black dots) plotted against BSA concentration. Each point is the average of the saturation times for at least three different aggregates. Red line is power law fit with exponent 0.26 ± 0.01 (best fit parameter). Red symbols are estimated values for Tsat from the hydrodynamic model in Supplementary Note 1.

