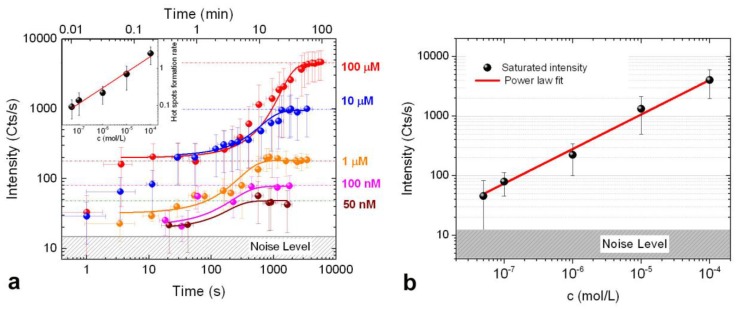
Figure 6.
(a) Time evolution of the SERS intensity at different BSA concentrations (colored dots). The time T0 = 0 is set at the onset of the process, when the first weak SERS signal is detected (real-time observation). Starting from T0 the signal is recorded at intervals corresponding to the integration time used in each spectrum. Solid lines are fits of data using a Boltzmann growth kinetics equation. (inset) Plot of the maximum signal growth rate vs BSA concentration. The solid red line is a power law fit with an exponent 0.40 ± 0.04 as best fit parameter. (b) Plot of the SERS intensity at saturation vs. BSA concentration (symbols). The red line is a power law fit with exponent 0.60 ± 0.04.

