Figure 4.
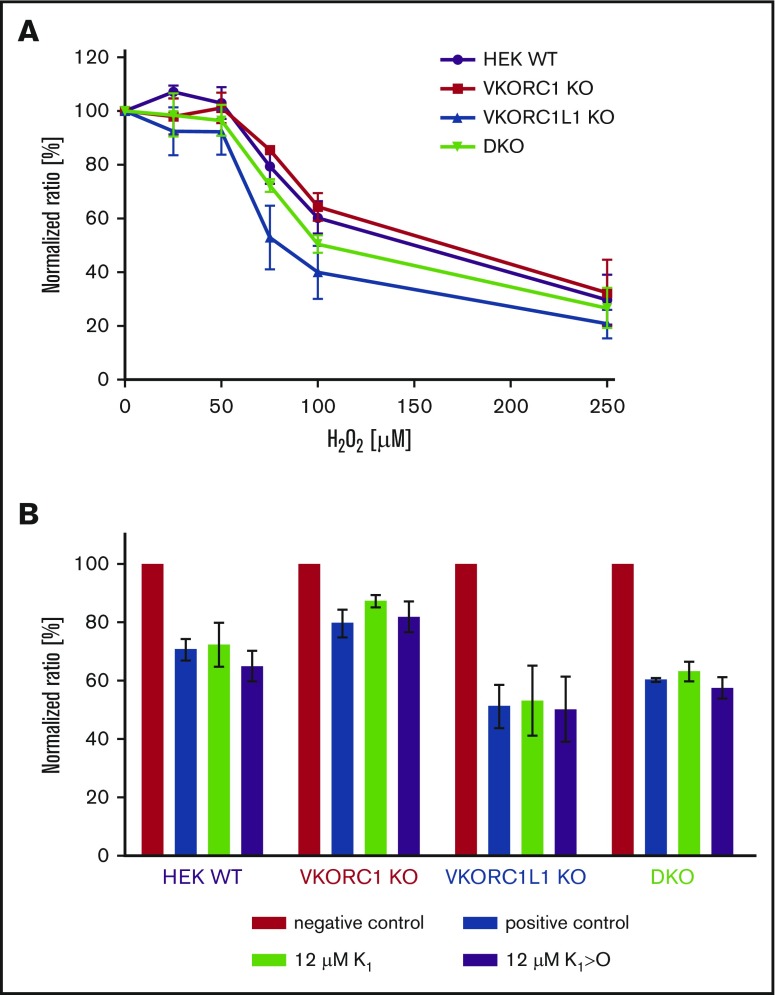
Effect of cell stress on VKOR KO cells. (A) Cell viability with regard to H2O2 treatment was assessed in WT (purple), VKORC1 KO (red), VKORC1L1 KO (blue), and DKO (green) HEK 293T. Curves showing normalized values for 3 replicates including error bars representing standard error of the mean. (B) Effect of K1 and K1>O treatment on cell viability. Negative control without H2O2; positive control with 75 µM H2O2. Cells were incubated with 75 µM H2O2 and K1 or K1>O (each 12 µM).

