Figure 2.
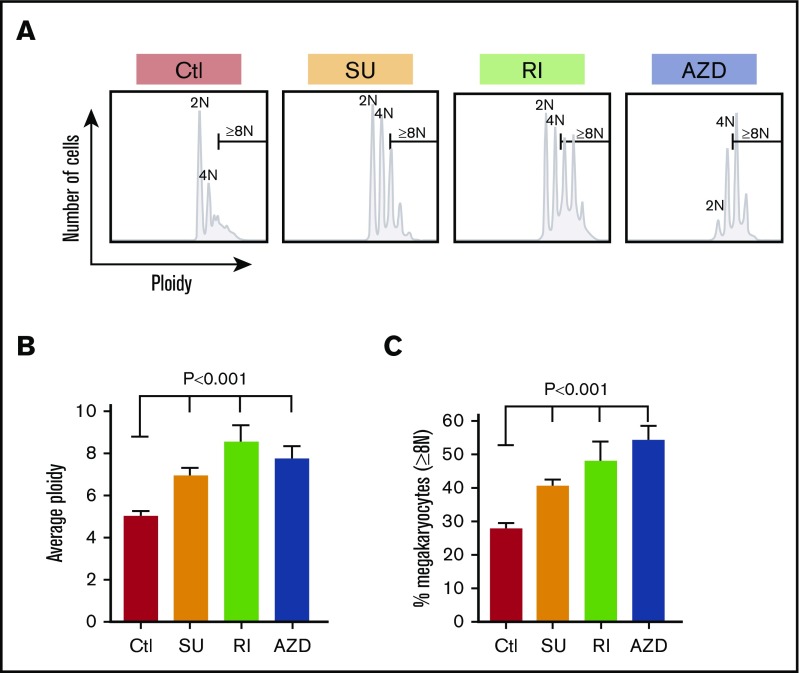
Ploidy of in vitro–grown megakaryocytes. (A) Example of ploidy distribution of day 12 CD42bHigh megakaryocytes after the indicated treatments. (B) Same as panel A, but showing mean ploidy ± 1 SEM. (C) Same as in panel B but mean percentage ± 1 SEM of megakaryocytes that were ≥8N. In both panels B and C, N = ≥5 independent experiments. P values were determined using 1-way ANOVA in comparison with the control. AZD, exposed to the aurora kinase inhibitor AZD1152; Ctl, control exposed to DMSO only; RI, exposed to the ROCK inhibitor Y27632; SU, exposed to the Src inhibitor SU6656.

