Figure 3.
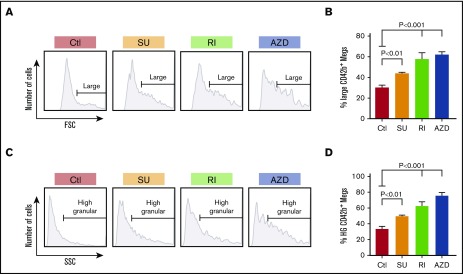
Size and granularity of in vitro–grown megakaryocytes in the presence of inhibitors. (A) Representative data of FSC on day 12 of in vitro–grown, CD42bHigh megakaryocytes. Cells have a wide size distribution, but with most of them being small megakaryocytes. Horizontal lines in the graphs indicate size range of the megakaryocytes classified as “large” megakaryocytes with FSC >70% of FSC of the control sample. (B) Mean percentage ± 1 SEM of the day 12, in vitro–grown, CD42bHigh inhibitor-treated and control megakaryocytes. P values were determined using 1-way ANOVA in comparison with the control. (C) Representative data of SSC of day 12, in vitro–grown, CD42bHigh megakaryocytes. Cells have wide granularity distribution, with most of them being low-granular megakaryocytes. Horizontal lines in the graphs indicate granularity range of the megakaryocytes classified as high-granular megakaryocytes with SSC >70% of the SSC in the control sample. (D) Mean percentage ± 1 SEM of the day 12, in vitro–grown, CD42bHigh inhibitor-treated and control megakaryocytes that are high-granular (HG). In both panels B and D, N = ≥6 independent experiments. P values were determined using 1-way ANOVA in comparison with the control.

