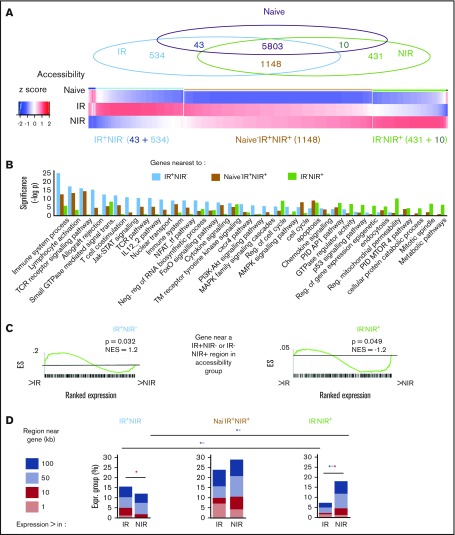
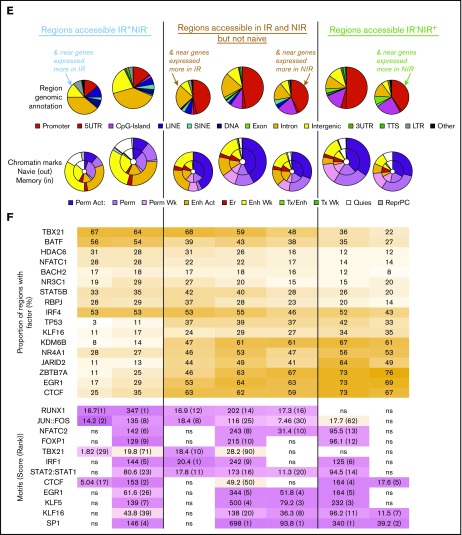
Figure 4.
Identification and characterization of chromatin accessibility in reactive and nonreactive CMV-specific T cells. (A) Overlap between regions accessible in CMV-specific T cells from NIR and IR recipients and naive CD8 T cells gave rise to 3 main chromatin accessibility groups: IR+NIR−, naive−IR+NIR+, and IR−NIR+. (B-C) The genes nearest to the regions were characterized by enrichment of signaling pathways (B) and their expression in IR and NIR cells (C). Gene set enrichment analysis plots show cumulative enrichment scores (ESs) across genes ranked by expression in IR to NIR, with lines indicating the presence in the ranking of a gene near a IR+NIR− or IR−NIR region. Normalized enrichment scores are indicated. (D) The proportion of genes with differential expression that have an accessible region within 1 to 100 kb of their transcriptional start site. *P < .05 in size range of matching color. (E) Characterization of the regions and the region subset that occur within 50 kb of a differentially expressed gene by their genomic annotation and chromatin state. Chromatin states from CD8+ naive (outer circle) and memory (inner circle) lymphocytes. Chromatin states: enhancer (Enh), repressive (Repr), permissive (Perm), transcription (Tx), quiescent (Quies), active (Act), or weak (Wk). (F) The proportion of the regions bound by different DNA-binding proteins in various tissues from publically available ChIP-seq data and DNA-binding motif enrichment. Enrichment reported as clover enrichment score and assessed against regions with matching GC content. Enrichment values colored by rank (given in brackets); motifs are significant (P < .05) unless marked nonsignificant (ns). LINE, long interspersed element; LTR, long terminal repeat; SINE, short interspersed element; TCR, T-cell receptor; TTS, transcription termination site; UTR, untranslated region.


