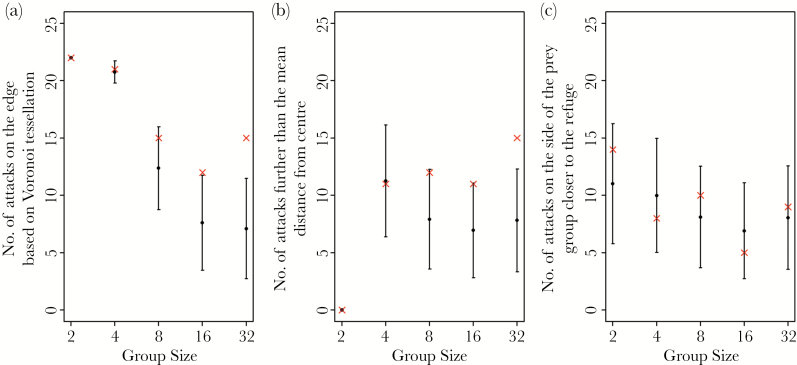
Figure 2.
The number of times for each group size that the observed attacks (cross) and random simulation of 10000 iterations (filled circles are means, with error bars showing 95% confidence intervals) was (a) on the edge, (b) further from the group centroid than the mean, and (c) to the far side of the group center relative to the refuge.

